Since it took me a considerable amount of time to come up with how to answer this question to Stanford University’s Probabilistic Graphical Models 1: Representation course, I decided I would be posting it online. Not because I want people to copy and paste it to get a full grade, but because, for a couple of hours, I wanted the course to give me a more thorough explanation on how to approach the problem.
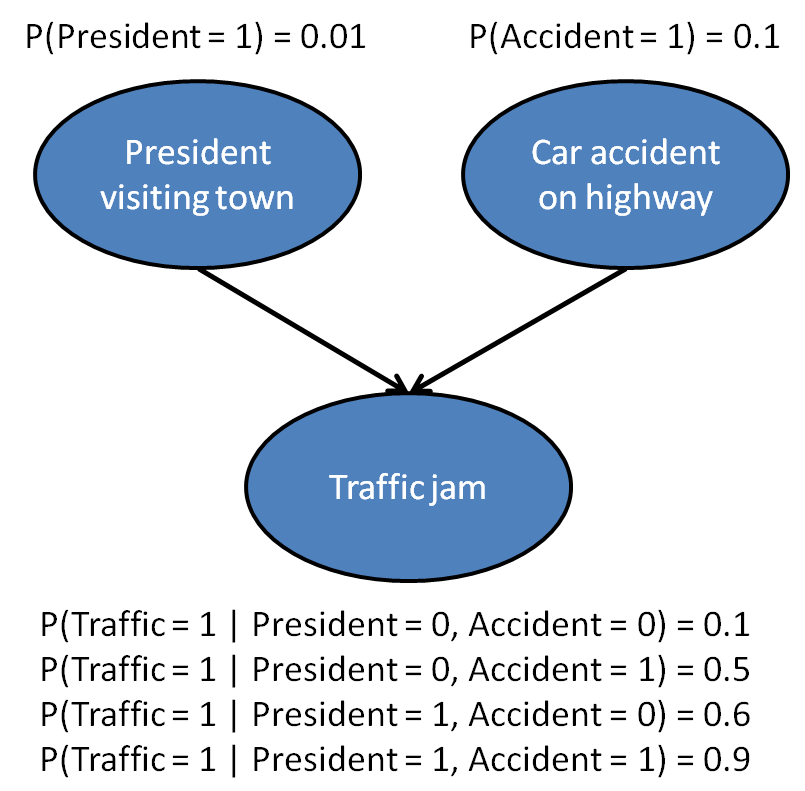
Consider the following model for traffic jams in a small town, which we assume can be caused by a car accident, or by a visit from the president (and the accompanying security motorcade).
Created by Stanford University
Calculate P(Accident = 1 | Traffic = 1) and P(Accident = 1 | Traffic = 1, President = 1). Separate your answers with a space, e.g., an answer of
0.15 0.25
means that P(Accident = 1 | Traffic = 1) = 0.15 and P(Accident = 1 | Traffic = 1, President = 1) = 0.25. Round your answers to two decimal places and write a leading zero, like in the example above.
a n + 1 = x n + 1 + n c n n + 1 ⟺ a n + 1 = a n + x n + 1 − a n n + 1
a_{n+1} = \frac{x_{n+1} + nc_n}{n+1} \newline
\iff a_{n+1} = a_n + \frac{x_{n+1} - a_n}{n+1}
a n + 1 = n + 1 x n + 1 + n c n ⟺ a n + 1 = a n + n + 1 x n + 1 − a n
P ( P = 1 ) = 0.01 P ( P = 0 ) = 1 − P ( P = 1 ) = 0.99
P(P=1) = 0.01 \newline
P(P=0) = 1 - P(P=1) = 0.99
P ( P = 1 ) = 0 . 0 1 P ( P = 0 ) = 1 − P ( P = 1 ) = 0 . 9 9
P ( A = 1 ) = 0.1 P ( A = 0 ) = 1 − P ( A = 1 ) = 0.9
P(A=1) = 0.1 \newline
P(A=0) = 1 - P(A=1) = 0.9
P ( A = 1 ) = 0 . 1 P ( A = 0 ) = 1 − P ( A = 1 ) = 0 . 9
P ( T = 1 ∣ P = 0 , A = 0 ) = 0.1 P ( T = 1 ∣ P = 0 , A = 1 ) = 0.5 P ( T = 1 ∣ P = 1 , A = 0 ) = 0.6 P ( T = 1 ∣ P = 1 , A = 1 ) = 0.9
P(T=1 \mid P=0, A=0) = 0.1 \newline
P(T=1 \mid P=0, A=1) = 0.5 \newline
P(T=1 \mid P=1, A=0) = 0.6 \newline
P(T=1 \mid P=1, A=1) = 0.9
P ( T = 1 ∣ P = 0 , A = 0 ) = 0 . 1 P ( T = 1 ∣ P = 0 , A = 1 ) = 0 . 5 P ( T = 1 ∣ P = 1 , A = 0 ) = 0 . 6 P ( T = 1 ∣ P = 1 , A = 1 ) = 0 . 9
Given it was observed a traffic jam, what are the odds of having a car accident on highway P ( A = 1 ∣ T = 1 ) = P ( A = 1 , T = 1 ) P ( T = 1 ) = 0.0504 0.1449 = 0.3478261 ≈ 0.35
P(A=1 \mid T=1) = \frac{P(A=1 , T=1)}{P(T=1)} \newline
= \frac{0.0504}{0.1449} \newline
= 0.3478261 \newline
\approx 0.35
P ( A = 1 ∣ T = 1 ) = P ( T = 1 ) P ( A = 1 , T = 1 ) = 0 . 1 4 4 9 0 . 0 5 0 4 = 0 . 3 4 7 8 2 6 1 ≈ 0 . 3 5
Given it was observed a traffic jam and the president visit to town, what are the odds of having a car accident on highway P ( A = 1 ∣ T = 1 , P = 1 ) = P ( A = 1 , T = 1 , P = 1 ) P ( T = 1 , P = 1 ) = 0.0009 0.0063 = 0.1428571 ≈ 0.14
P(A=1 \mid T=1, P=1) = \frac{P(A=1 , T=1, P=1)}{P(T=1, P=1)} \newline
= \frac{0.0009}{0.0063} \newline
= 0.1428571 \newline
\approx 0.14
P ( A = 1 ∣ T = 1 , P = 1 ) = P ( T = 1 , P = 1 ) P ( A = 1 , T = 1 , P = 1 ) = 0 . 0 0 6 3 0 . 0 0 0 9 = 0 . 1 4 2 8 5 7 1 ≈ 0 . 1 4
P ( A = 1 , T = 1 ) = P ( P = 0 , A = 1 , T = 1 ) + P ( P = 1 , A = 1 , T = 1 ) = 0.0495 + 0.0009 = 0.0504
P(A=1 , T=1) = P(P=0, A=1 , T=1) + P(P=1, A=1 , T=1) \newline
= 0.0495 + 0.0009 \newline
= 0.0504
P ( A = 1 , T = 1 ) = P ( P = 0 , A = 1 , T = 1 ) + P ( P = 1 , A = 1 , T = 1 ) = 0 . 0 4 9 5 + 0 . 0 0 0 9 = 0 . 0 5 0 4
P ( P = 0 , A = 1 , T = 1 ) = P ( P = 0 ) × P ( A = 1 ) × P ( T = 1 ∣ P = 0 , A = 1 ) = 0.99 × 0.1 × 0.5 = 0.0495
P(P=0, A=1 , T=1) = P(P=0) \times P(A=1) \times P(T=1 \mid P=0, A=1) \newline
= 0.99 \times 0.1 \times 0.5 \newline
= 0.0495
P ( P = 0 , A = 1 , T = 1 ) = P ( P = 0 ) × P ( A = 1 ) × P ( T = 1 ∣ P = 0 , A = 1 ) = 0 . 9 9 × 0 . 1 × 0 . 5 = 0 . 0 4 9 5
P ( P = 1 , A = 1 , T = 1 ) = P ( P = 1 ) × P ( A = 1 ) × P ( T = 1 ∣ P = 1 , A = 1 ) = 0.01 × 0.1 × 0.9 = 0.0009
P(P=1, A=1 , T=1) = P(P=1) \times P(A=1) \times P(T=1 \mid P=1, A=1) \newline
= 0.01 \times 0.1 \times 0.9 \newline
= 0.0009
P ( P = 1 , A = 1 , T = 1 ) = P ( P = 1 ) × P ( A = 1 ) × P ( T = 1 ∣ P = 1 , A = 1 ) = 0 . 0 1 × 0 . 1 × 0 . 9 = 0 . 0 0 0 9
P ( T = 1 ) = P ( T = 1 , P = 0 , A = 0 ) + P ( T = 1 , P = 0 , A = 1 ) + P ( T = 1 , P = 1 , A = 0 ) + P ( T = 1 , P = 1 , A = 1 ) = 0.0891 + 0.0495 + 0.0054 + 0.0009 = 0.1449
P(T=1) = P(T=1, P=0, A=0) + P(T=1, P=0, A=1) + P(T=1, P=1, A=0) + P(T=1, P=1, A=1) \newline
= 0.0891 + 0.0495 + 0.0054 + 0.0009 \newline
= 0.1449
P ( T = 1 ) = P ( T = 1 , P = 0 , A = 0 ) + P ( T = 1 , P = 0 , A = 1 ) + P ( T = 1 , P = 1 , A = 0 ) + P ( T = 1 , P = 1 , A = 1 ) = 0 . 0 8 9 1 + 0 . 0 4 9 5 + 0 . 0 0 5 4 + 0 . 0 0 0 9 = 0 . 1 4 4 9
P ( T = 1 , P = 0 , A = 0 ) = P ( P = 0 ) × P ( A = 0 ) × P ( T = 1 ∣ P = 0 , A = 0 ) = 0.99 × 0.9 × 0.1 = 0.0891
P(T=1, P=0, A=0) = P(P=0) \times P(A=0) \times P(T=1 \mid P=0, A=0) \newline
= 0.99 \times 0.9 \times 0.1 \newline
= 0.0891
P ( T = 1 , P = 0 , A = 0 ) = P ( P = 0 ) × P ( A = 0 ) × P ( T = 1 ∣ P = 0 , A = 0 ) = 0 . 9 9 × 0 . 9 × 0 . 1 = 0 . 0 8 9 1
P ( T = 1 , P = 0 , A = 1 ) = P ( P = 0 ) × P ( A = 1 ) × P ( T = 1 ∣ P = 0 , A = 1 ) = 0.99 × 0.1 × 0.5 = 0.0495
P(T=1, P=0, A=1) = P(P=0) \times P(A=1) \times P(T=1 \mid P=0, A=1) \newline
= 0.99 \times 0.1 \times 0.5 \newline
= 0.0495
P ( T = 1 , P = 0 , A = 1 ) = P ( P = 0 ) × P ( A = 1 ) × P ( T = 1 ∣ P = 0 , A = 1 ) = 0 . 9 9 × 0 . 1 × 0 . 5 = 0 . 0 4 9 5
P ( T = 1 , P = 1 , A = 0 ) = P ( P = 1 ) × P ( A = 0 ) × P ( T = 1 ∣ P = 1 , A = 0 ) = 0.01 × 0.9 × 0.6 = 0.0054
P(T=1, P=1, A=0) = P(P=1) \times P(A=0) \times P(T=1 \mid P=1, A=0) \newline
= 0.01 \times 0.9 \times 0.6 \newline
= 0.0054
P ( T = 1 , P = 1 , A = 0 ) = P ( P = 1 ) × P ( A = 0 ) × P ( T = 1 ∣ P = 1 , A = 0 ) = 0 . 0 1 × 0 . 9 × 0 . 6 = 0 . 0 0 5 4
P ( T = 1 , P = 1 ) = P ( A = 0 , T = 1 , P = 1 ) + P ( A = 1 , T = 1 , P = 1 ) = 0.0054 + 0.0009 = 0.0063
P(T=1, P=1) = P(A=0, T=1, P=1) + P(A=1, T=1, P=1) \newline
= 0.0054 + 0.0009 \newline
= 0.0063
P ( T = 1 , P = 1 ) = P ( A = 0 , T = 1 , P = 1 ) + P ( A = 1 , T = 1 , P = 1 ) = 0 . 0 0 5 4 + 0 . 0 0 0 9 = 0 . 0 0 6 3